
Unity Pipeline Experimental Update Adds Command-Line Profiler Captures and Memory Snapshots
Unity Pipeline 0.10.0-exp.1 introduces profiler recordings, memory snapshots and more flexible editor captures through its command interface. The November 3 update is experimental and includes breaking parameter changes for automated tools.
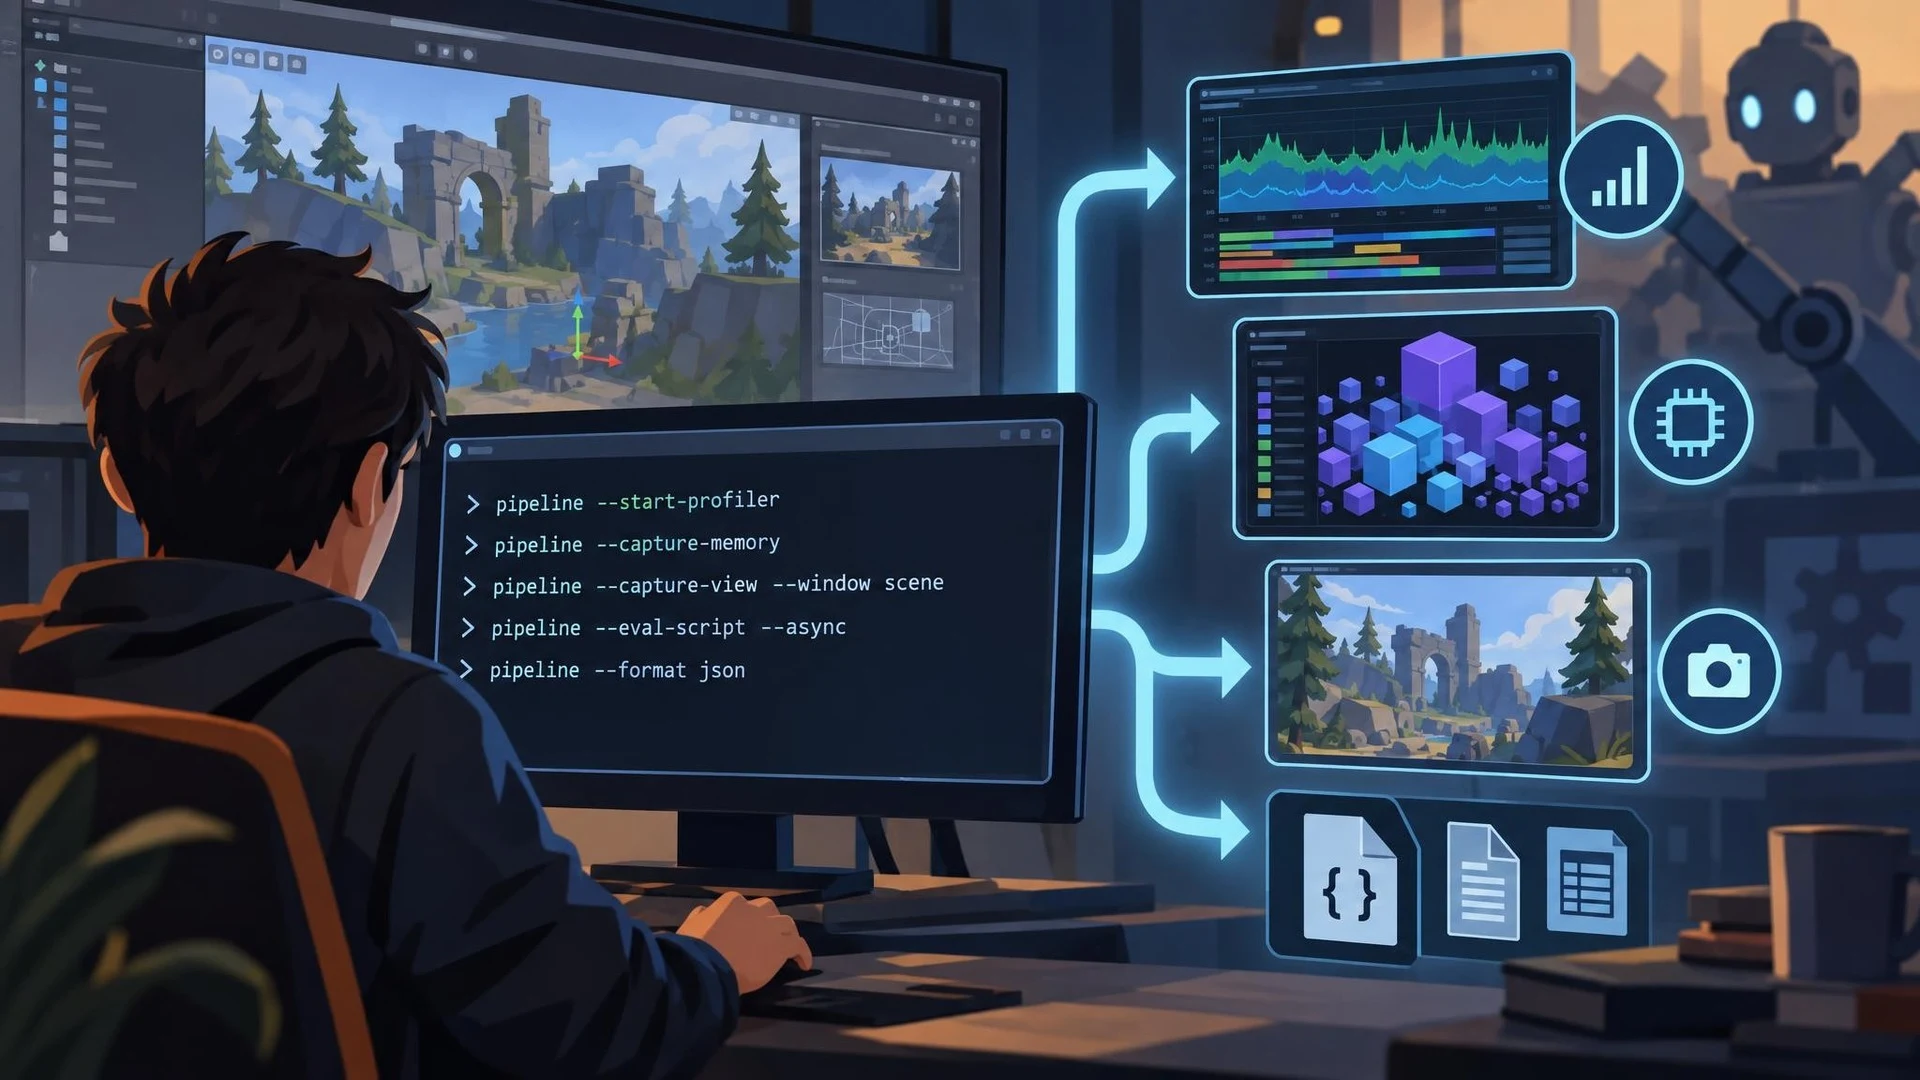
Unity's automation toolchain has received a substantial experimental update. In an official post on November 3, 2026, Unity announced Pipeline 0.10.0-exp.1, adding several operations that make it easier to inspect an editor or development player without manually navigating the graphical interface.
The headline additions are profiler recording and memory snapshots. Commands can start frame capture from the Unity Editor or a connected development player, inspect recording status and save a memory snapshot. This is useful when a developer wants to make performance checks repeatable or let a supervised coding agent collect diagnostic evidence before proposing a change. It does not replace understanding what the captured data means.
The update also expands visual capture. Tools can capture an editor window by title or type, or obtain a Scene view image from the scene camera or the window as displayed. Unity says camera captures can include overlay user interfaces in URP and HDRP. The ability to request a specific view can help automated reviews, provided the intended camera and scene state are consistent between runs.
For C# automation, script evaluation now accepts more complete scripts, asynchronous waiting and a dry-run compilation option. Command results can be formatted for human reading, tab-separated values or JSON. Unity has also added commands for multiplayer roles on supported newer editor versions and improved reporting of test results and editor state.
The compatibility warnings matter as much as the features. The release standardizes command arguments in kebab-case, rejects unknown parameters and changes certain command conventions. Existing scripts that previously tolerated a differently named option may fail. The Pipeline Runtime settings page is also labeled experimental, with a currently documented focus on desktop player builds rather than unrestricted deployment on every platform.
A practical evaluation should use a disposable Unity project with one intentionally costly scene. First, collect a baseline profiler recording and memory snapshot. Change a known source of allocation, repeat the capture and compare the results. Then verify the automated workflow's error handling by sending an invalid parameter and testing how its script reacts. This is a proposed experiment, not a published benchmark of the new release.
Teams using AI agents should separate data collection from code modification. An agent may be able to trigger the profiler, but a tool response is not proof that a frame-time regression is fixed. Save the diagnostic artifacts, keep the Unity version and package version pinned, and review changes before applying them to a working branch.
Pipeline 0.10.0-exp.1 is particularly notable because it brings measurement, editor context and command execution into the same automated workflow. Its experimental status and interface changes make it appropriate for controlled trials before production adoption.
Rate this story
What did you think of this article?
Log in to rate this story, comment and like replies.
Log inNo comments yet. Be the first to share your thoughts.
More stories

Unreal Engine 5.9 Preview Is Planned for Next Week, With Web Targeting on the Agenda
Epic has confirmed plans for an Unreal Engine 5.9 Preview in the week following November 3. Its initial outline mentions AI workflows, web targeting, rendering and animation, but detailed release notes and general availability are still pending.

Unity 6000.6.8f1 Addresses 2D Shadow Memory, Navigation and Reflection Probe Issues
Unity released 6000.6.8f1 on November 3 with fixes for leaking ShadowCaster2D meshes, flickering 2D shadows and NavMesh portal data. It also changes how certain reflection probes are baked, requiring migration checks.
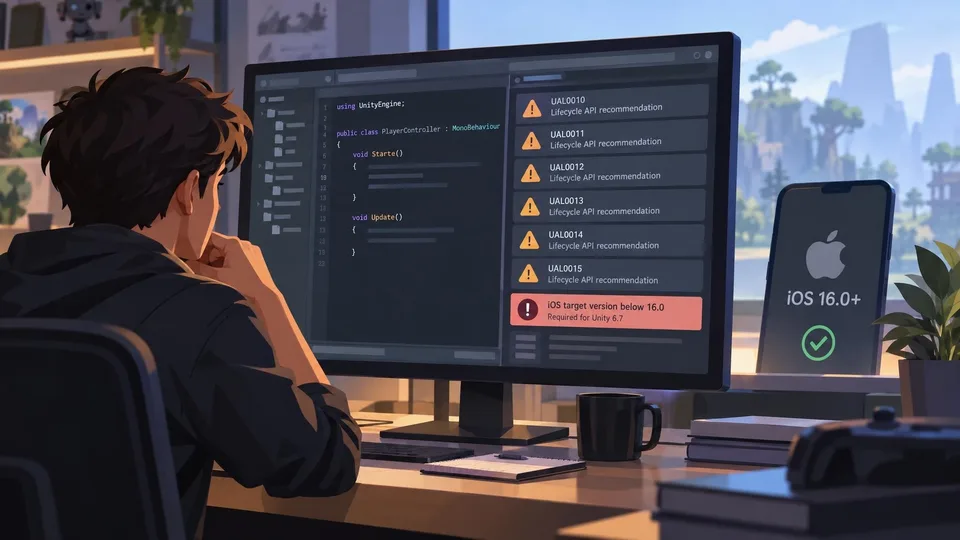
Unity Project Auditor Rules 3.2.0 Expands C# Lifecycle and iOS Compatibility Checks
Unity’s Project Auditor Rules package reached 3.2.0 on November 2, adding analyzer recommendations for lifecycle APIs and minimum iOS targeting in Unity 6.7. These are static-analysis rules, not changes to game runtime behavior.
Comments