
GPUSight 1.0 Arrives as a Unity Rendering Bottleneck Analysis Tool
GPUSight is a newly listed third-party Unity profiler aimed at rendering and shader performance analysis. Its publisher advertises frame-time snapshots, spike inspection and performance budgets; independent verification will require hands-on testing.
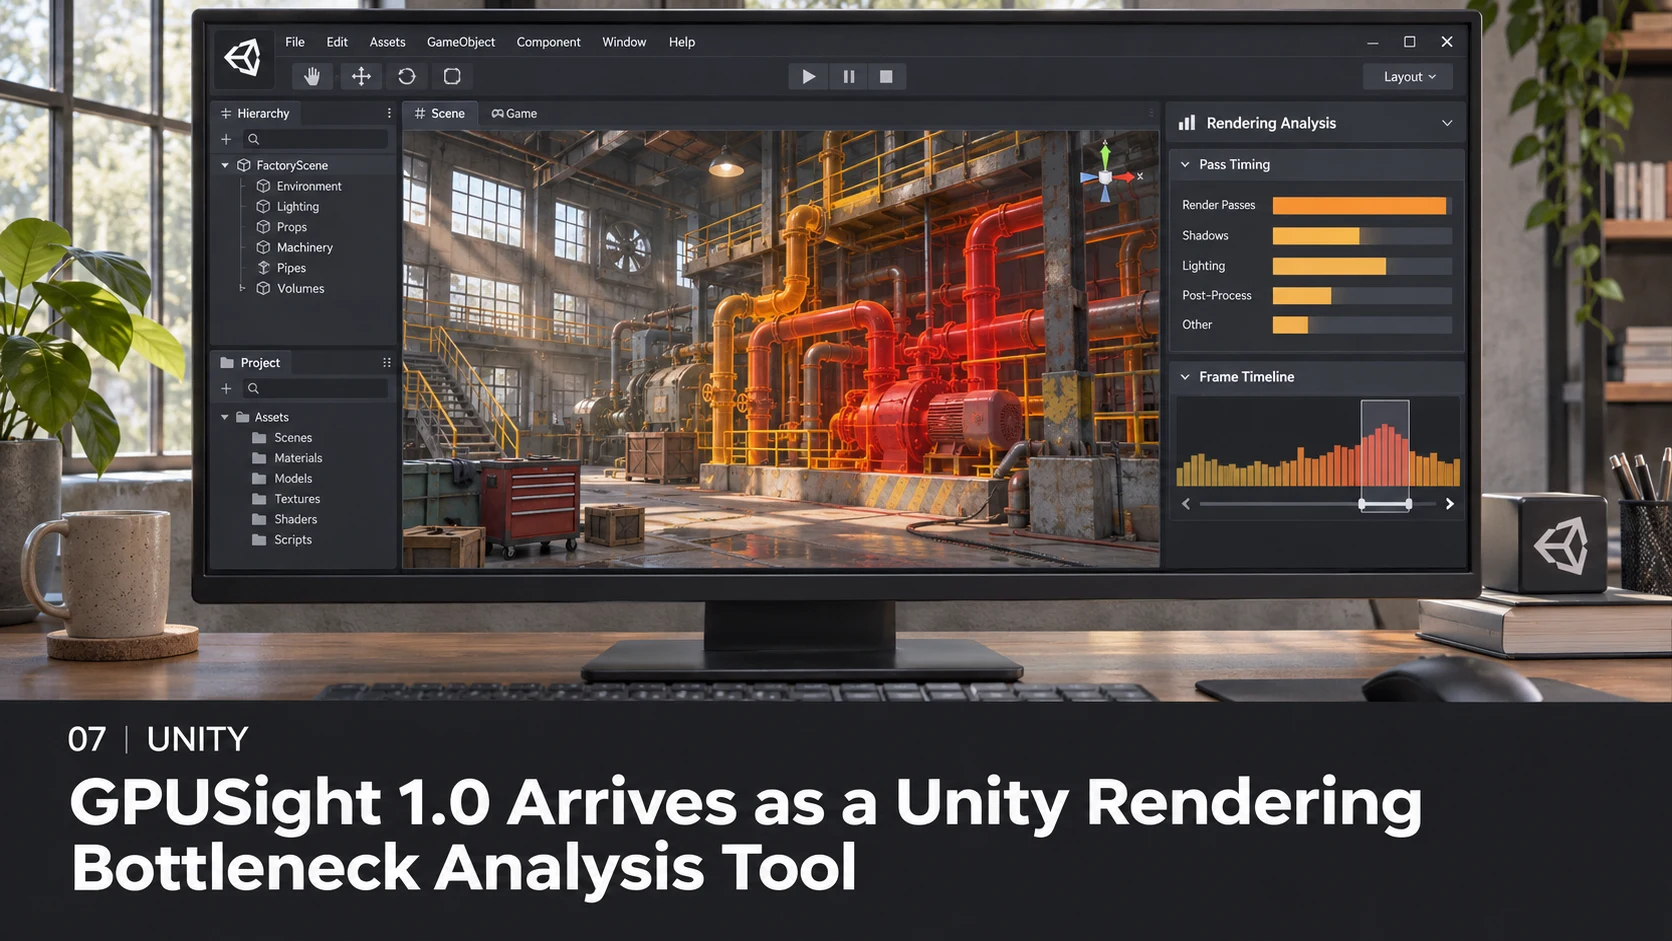
Rendering optimization often begins with an uncomfortable question: which subsystem actually caused a slow frame? A new Unity Asset Store entry, GPUSight - Find Rendering & Shader Performance Bottlenecks, offers another set of tools for investigating that problem. The listing dates version 1.0 to November 10, 2026, and identifies 7wolves as the publisher.
According to the seller's description, GPUSight collects available CPU and GPU frame timings during Play Mode and presents a history of frame times, marked spikes and P95/P99 indicators. These statistics matter because a game with an acceptable average can still feel inconsistent when individual frames take far longer than usual. The publisher also describes performance profiles and budgets, allowing a team to compare recorded timings against its targets.
The package includes snapshot export and import, with JSON files intended to preserve measurements and permit before-and-after comparisons. That may be useful for studios maintaining several graphics branches or reviewing a shader optimization weeks after the original investigation. A saved snapshot is not proof that two tests used identical conditions, however; developers must record build version, graphics settings, resolution and hardware alongside the values.
The listing names Unity 2022.3 or newer and the Built-in, URP and HDRP rendering pipelines as supported targets. It does not mean every profiling counter is exposed on every platform or graphics API. The product is a third-party extension, separate from Unity's own Profiler and Frame Debugger, and no independent performance comparison has been established by the store page.
A practical trial would create a benchmark scene with an intentionally costly transparent effect, a dense mesh group and several heavy materials. Record a quiet baseline, introduce each cost separately, and check whether GPUSight highlights the resulting frame spikes. Repeat with the built-in Unity Profiler to understand which measurements agree, which differ and which can be attributed to the GPU versus the main thread.
This release is relevant to technical artists and developers because it concentrates attention on repeatable measurements. Its usefulness will depend less on dashboard appearance than on data availability, low measurement overhead, clear export formats and whether the findings lead to specific optimizations.
Rate this story
What did you think of this article?
Log in to rate this story, comment and like replies.
Log inNo comments yet. Be the first to share your thoughts.
More stories

ElevenLabs Releases a Unity SDK for Live Voice Conversations With NPCs
ElevenLabs has published a Unity SDK connecting scene characters to conversational voice agents. The developer documentation distinguishes supported desktop and WebGL targets from beta mobile and XR integration.

Gridworks Adds a Modular Low-Poly Industry and City Builder Kit for Unity
Gridworks has appeared on Unity Asset Store as a modular industrial environment kit with city-builder-oriented assets. The listing specifies supported URP and HDRP configurations but does not constitute an engine update.
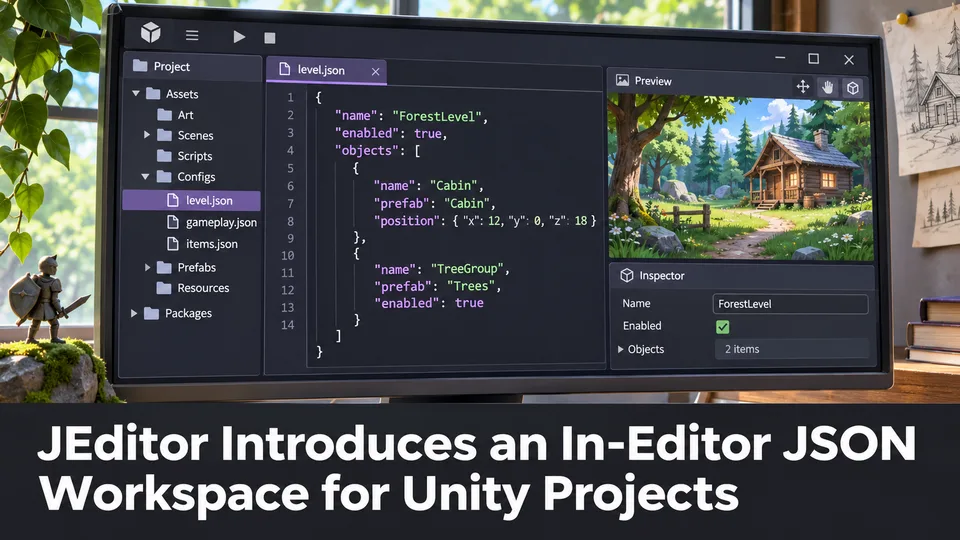
JEditor Introduces an In-Editor JSON Workspace for Unity Projects
JEditor 1.0.0 has been listed on Unity Asset Store as a JSON-focused editor utility. Its stated focus on inspection, comparison and validation makes it relevant to configuration-heavy Unity projects.
Comments